Now in closed beta

Never miss a stat.
Never stop improving.

Know your game, so you can grow your game.

Players get better when they can see their game. Track shots, goals, assists, plus/minus, PIMs, faceoffs, and more from the stands or the bench, and share it with everyone who helps them grow.

Request access →Closed beta · iPhone and Android
Offline-first. Never lose a stat.
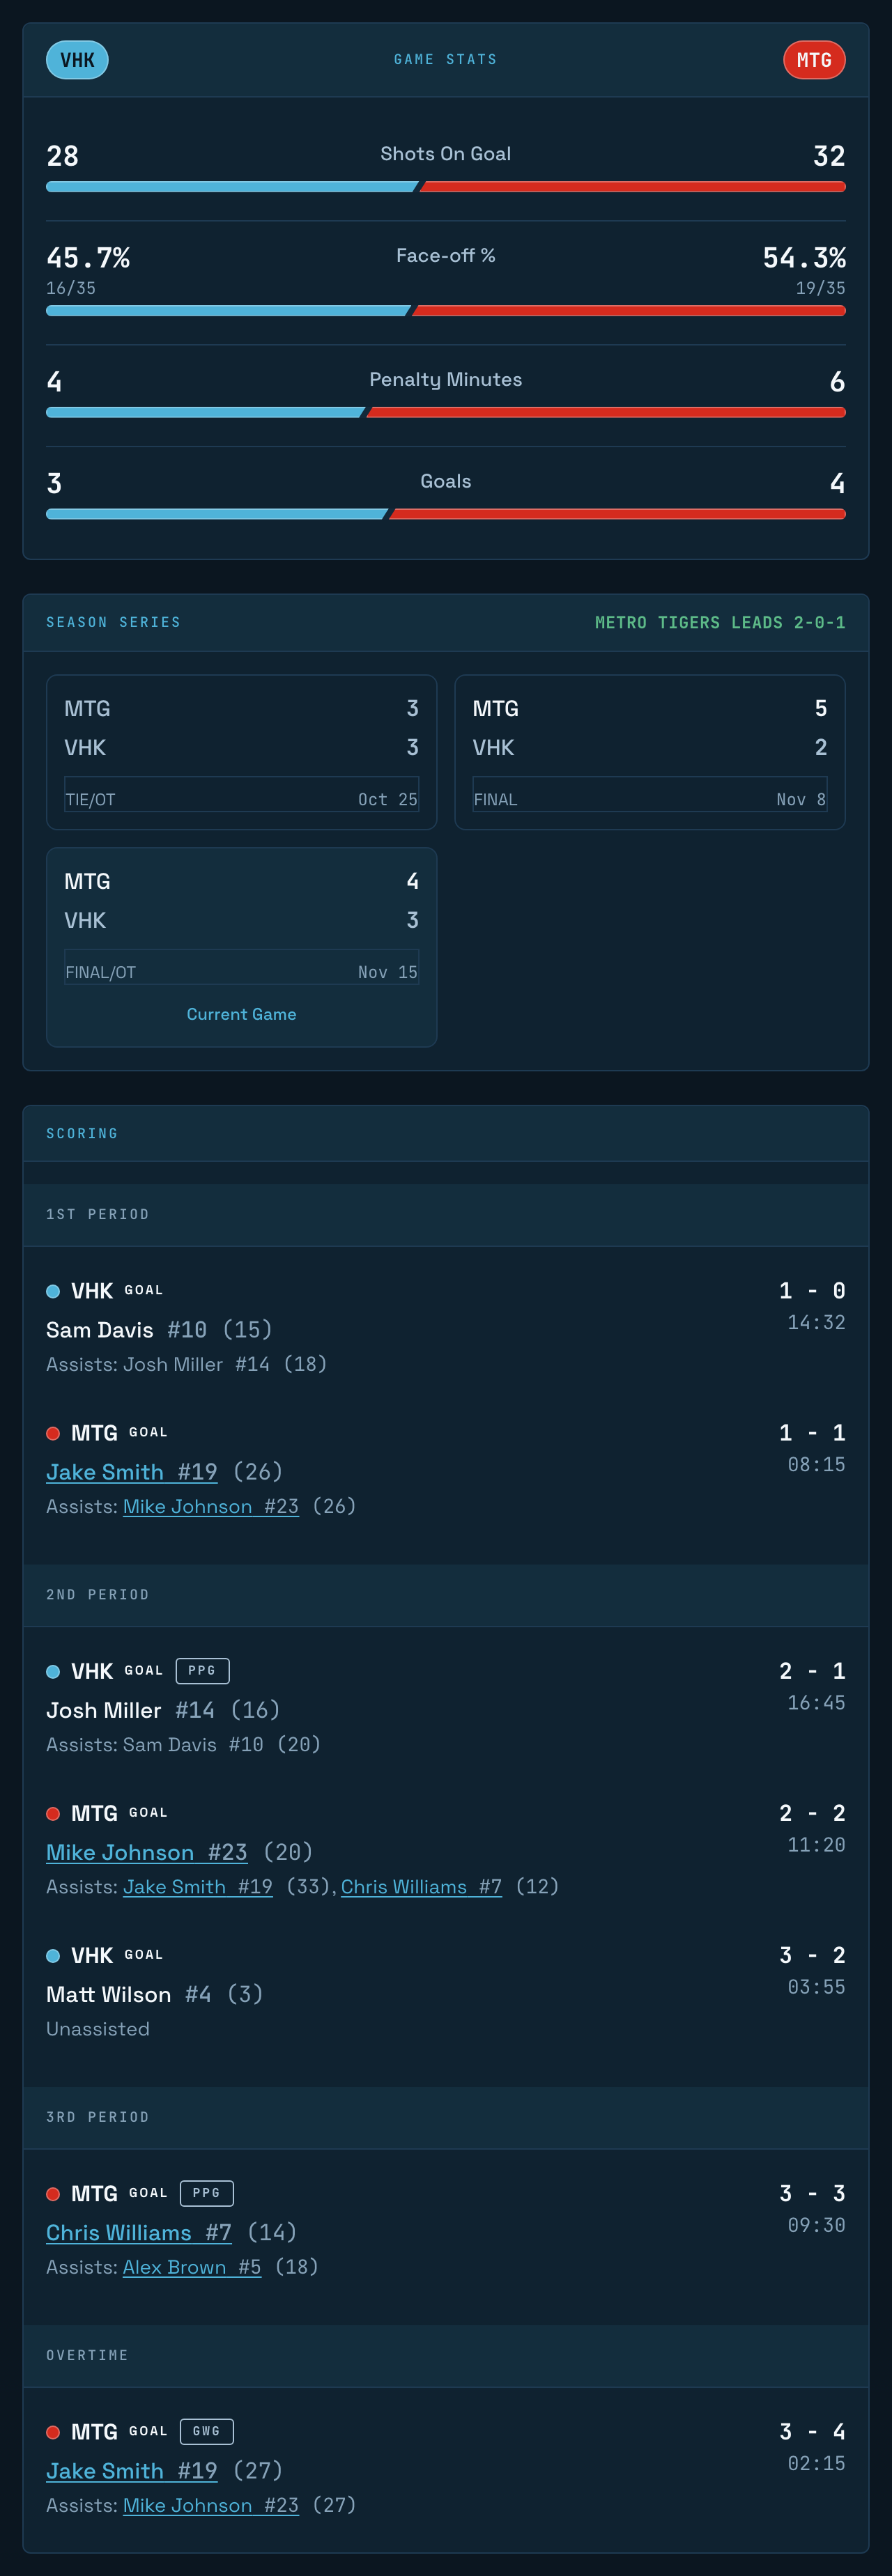
Team Report game view for Valley Hawks at Metro Tigers: game stats for shots, face-offs, penalty minutes and goals, the season series, and the scoring summary with each goal's scorer, assists, and time
Team ReportEvery goal, every player
Why IceStats Pro

Better players start with knowing their game.

Built for live play

Goals, shots, faceoffs and penalties in a few taps. Log it in seconds and keep your eyes on the game.

Offline-first

Every stat is saved on your phone the instant you tap it, and syncs to the cloud when the rink Wi-Fi comes back.

Reports coaches respect

Clean per-player and full-team reports that look pro and put real numbers behind every development conversation.

Player or full team

Track one player or the whole roster. Stats roll up across teams, leagues, and seasons, so you can watch a player grow.

Want the step-by-step? See how it works.

The app

Track the game from the stands.

A few taps per play, offline at any rink. On iPhone and Android.
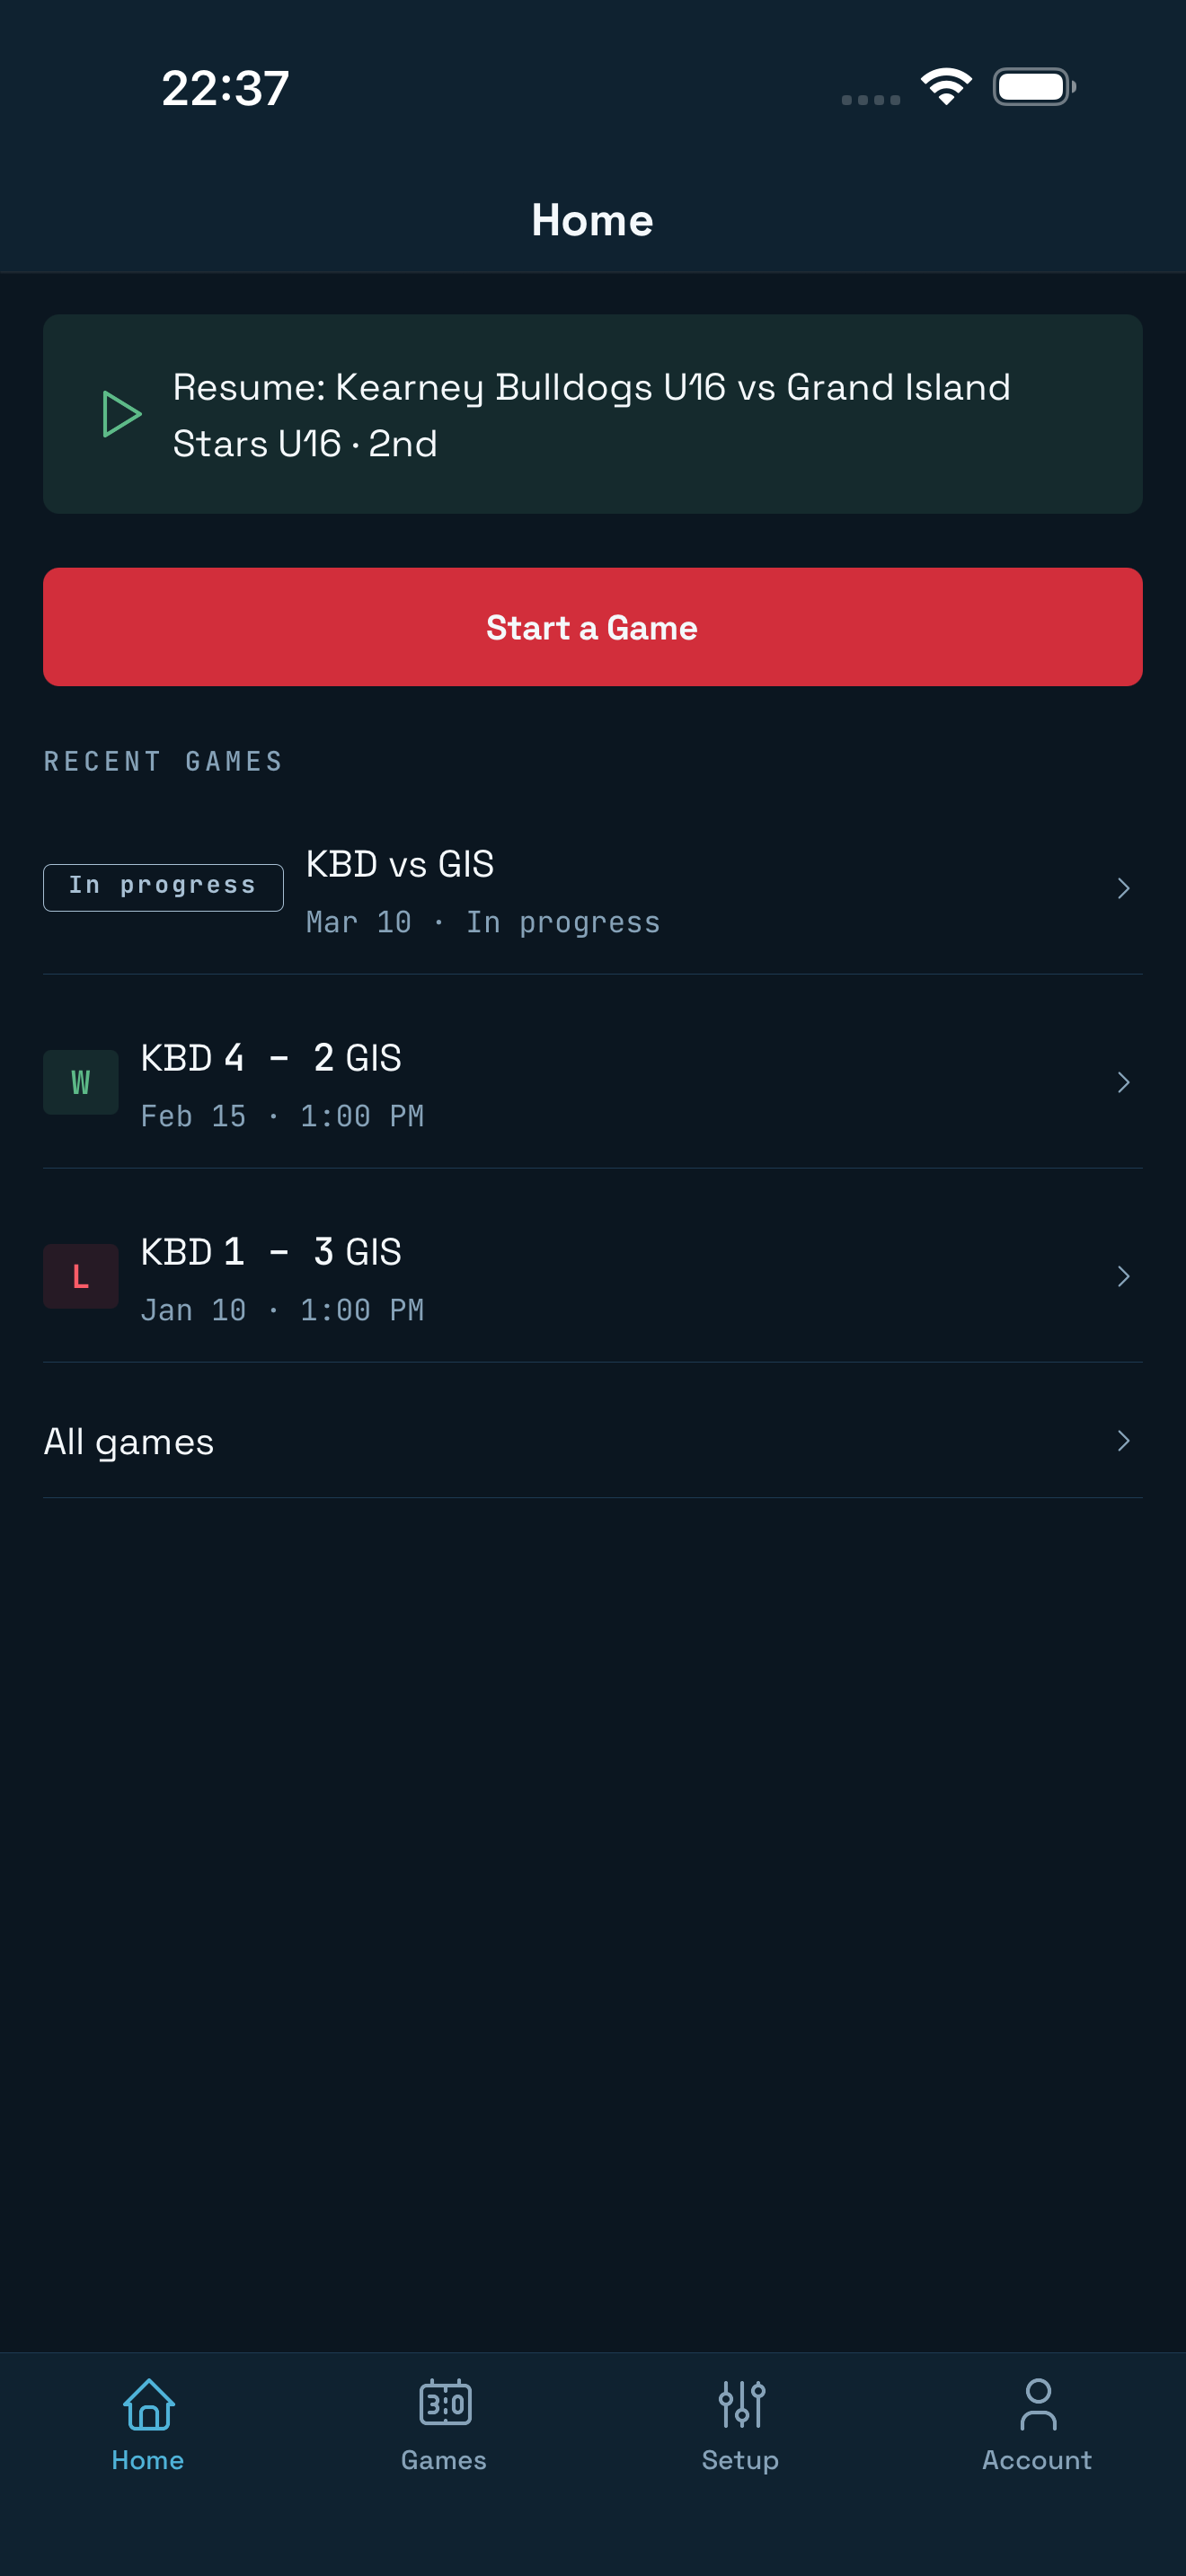
Home tab showing a Resume banner for the in-progress game, a Start a Game button, and recent games: a matchup in progress, a 4-2 win, and a 1-3 loss
HomeWhere the season stands
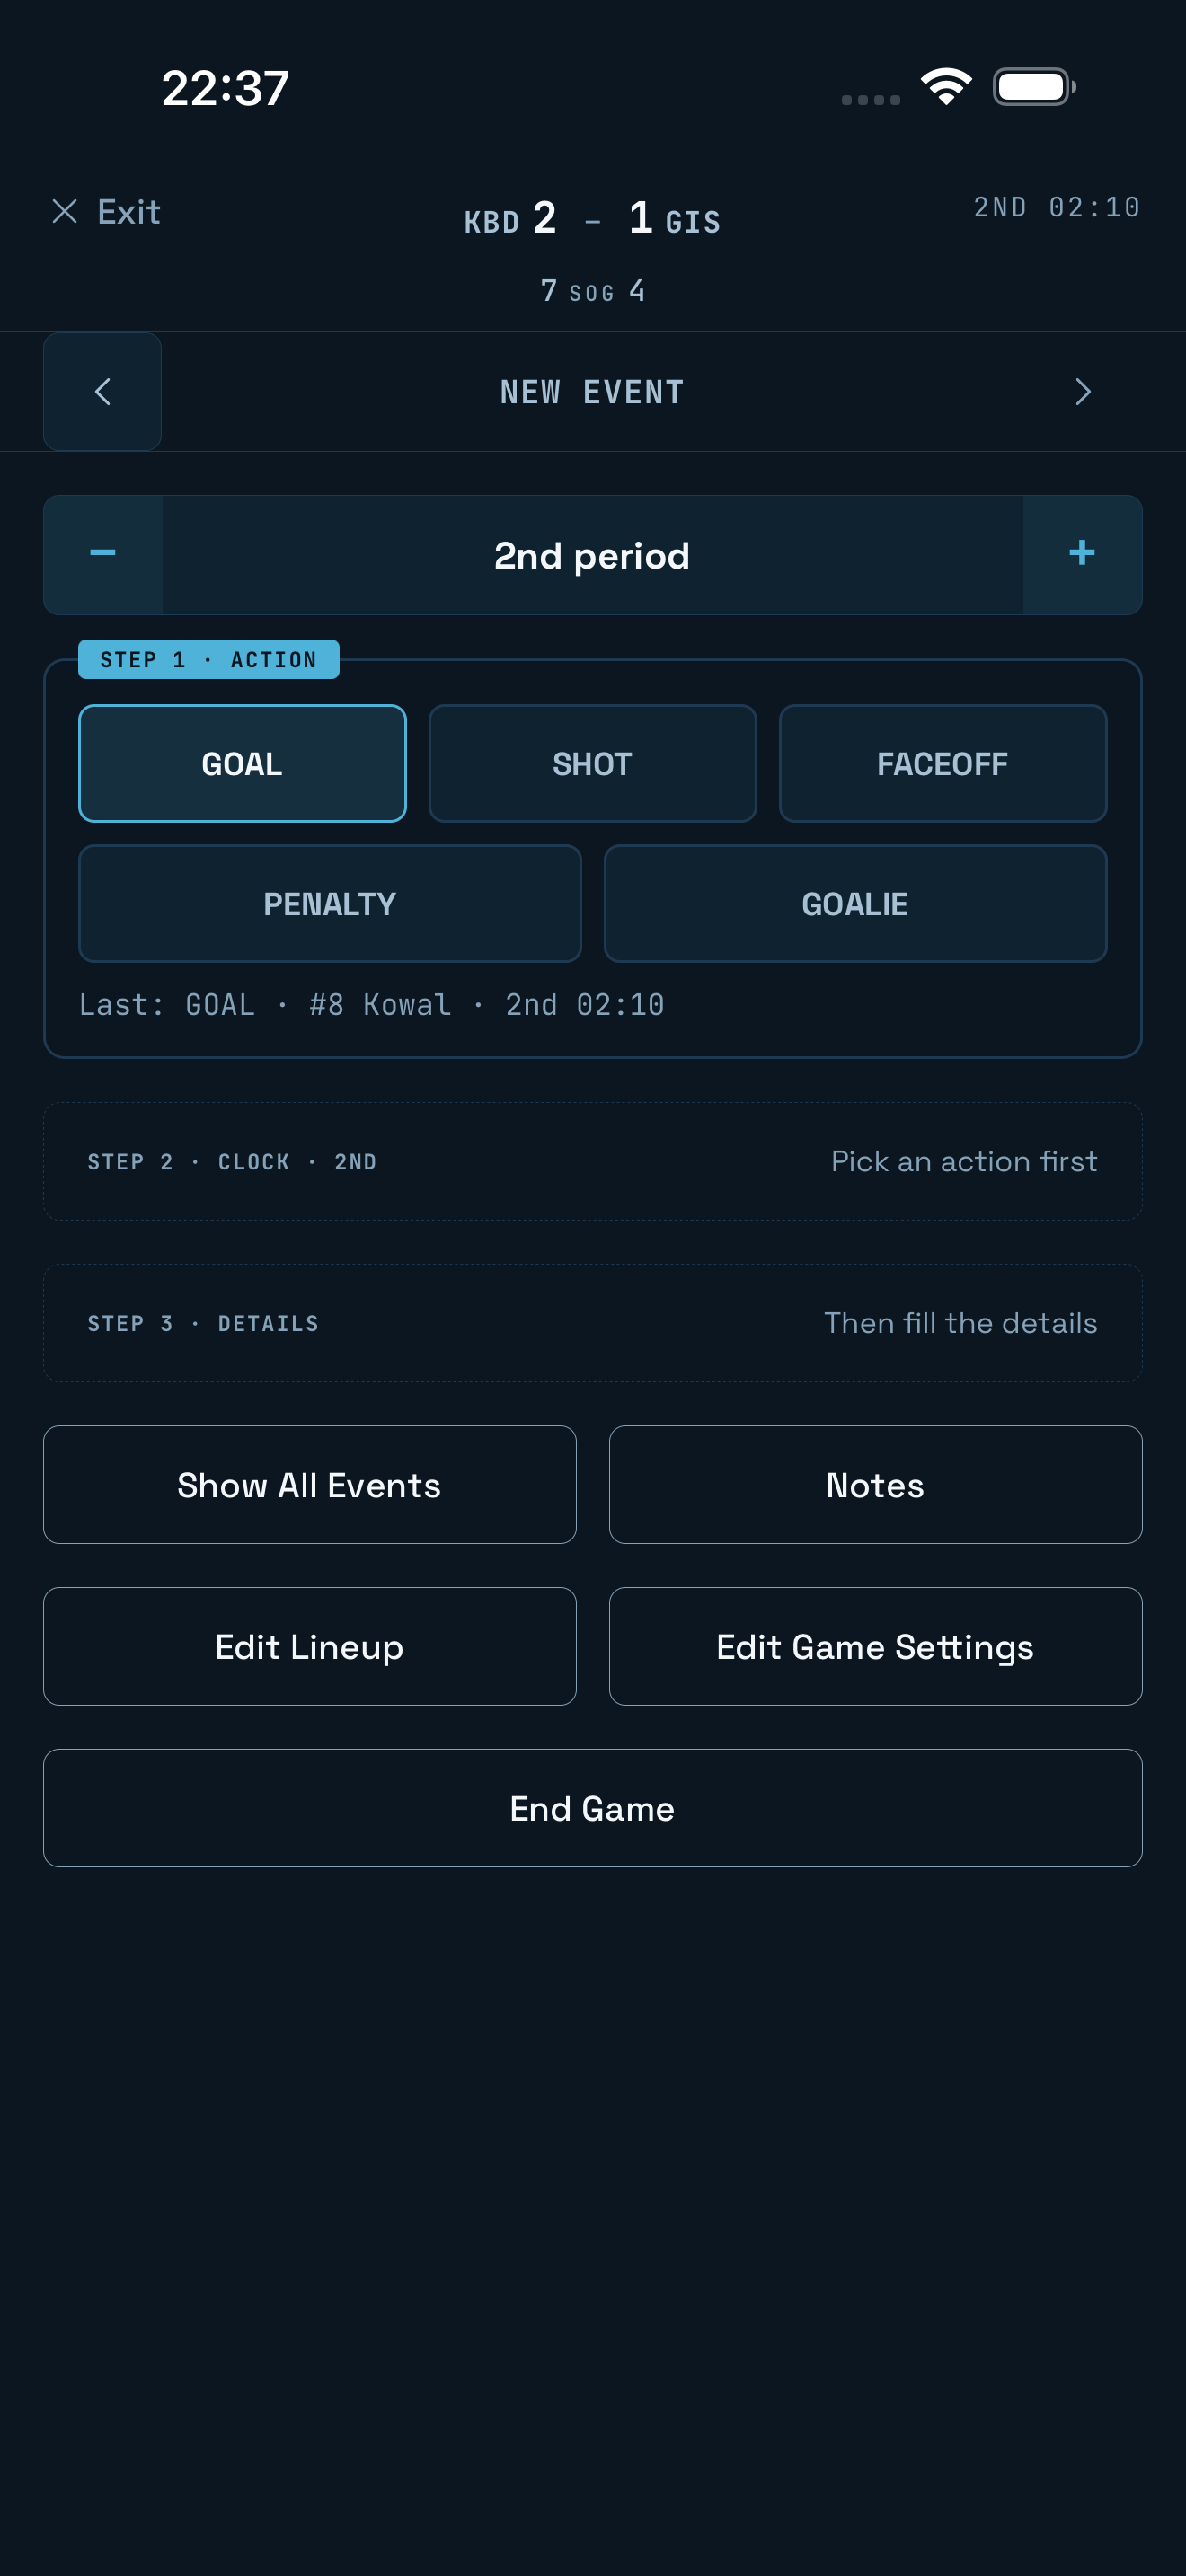
Live game tracking screen showing the Kearney Bulldogs leading the Grand Island Stars 2 to 1 in the second period, 7 to 4 shots on goal, Goal/Shot/Faceoff/Penalty/Goalie action buttons, and the last event, a goal by number 8 Kowal
Game trackingEvery play, in seconds
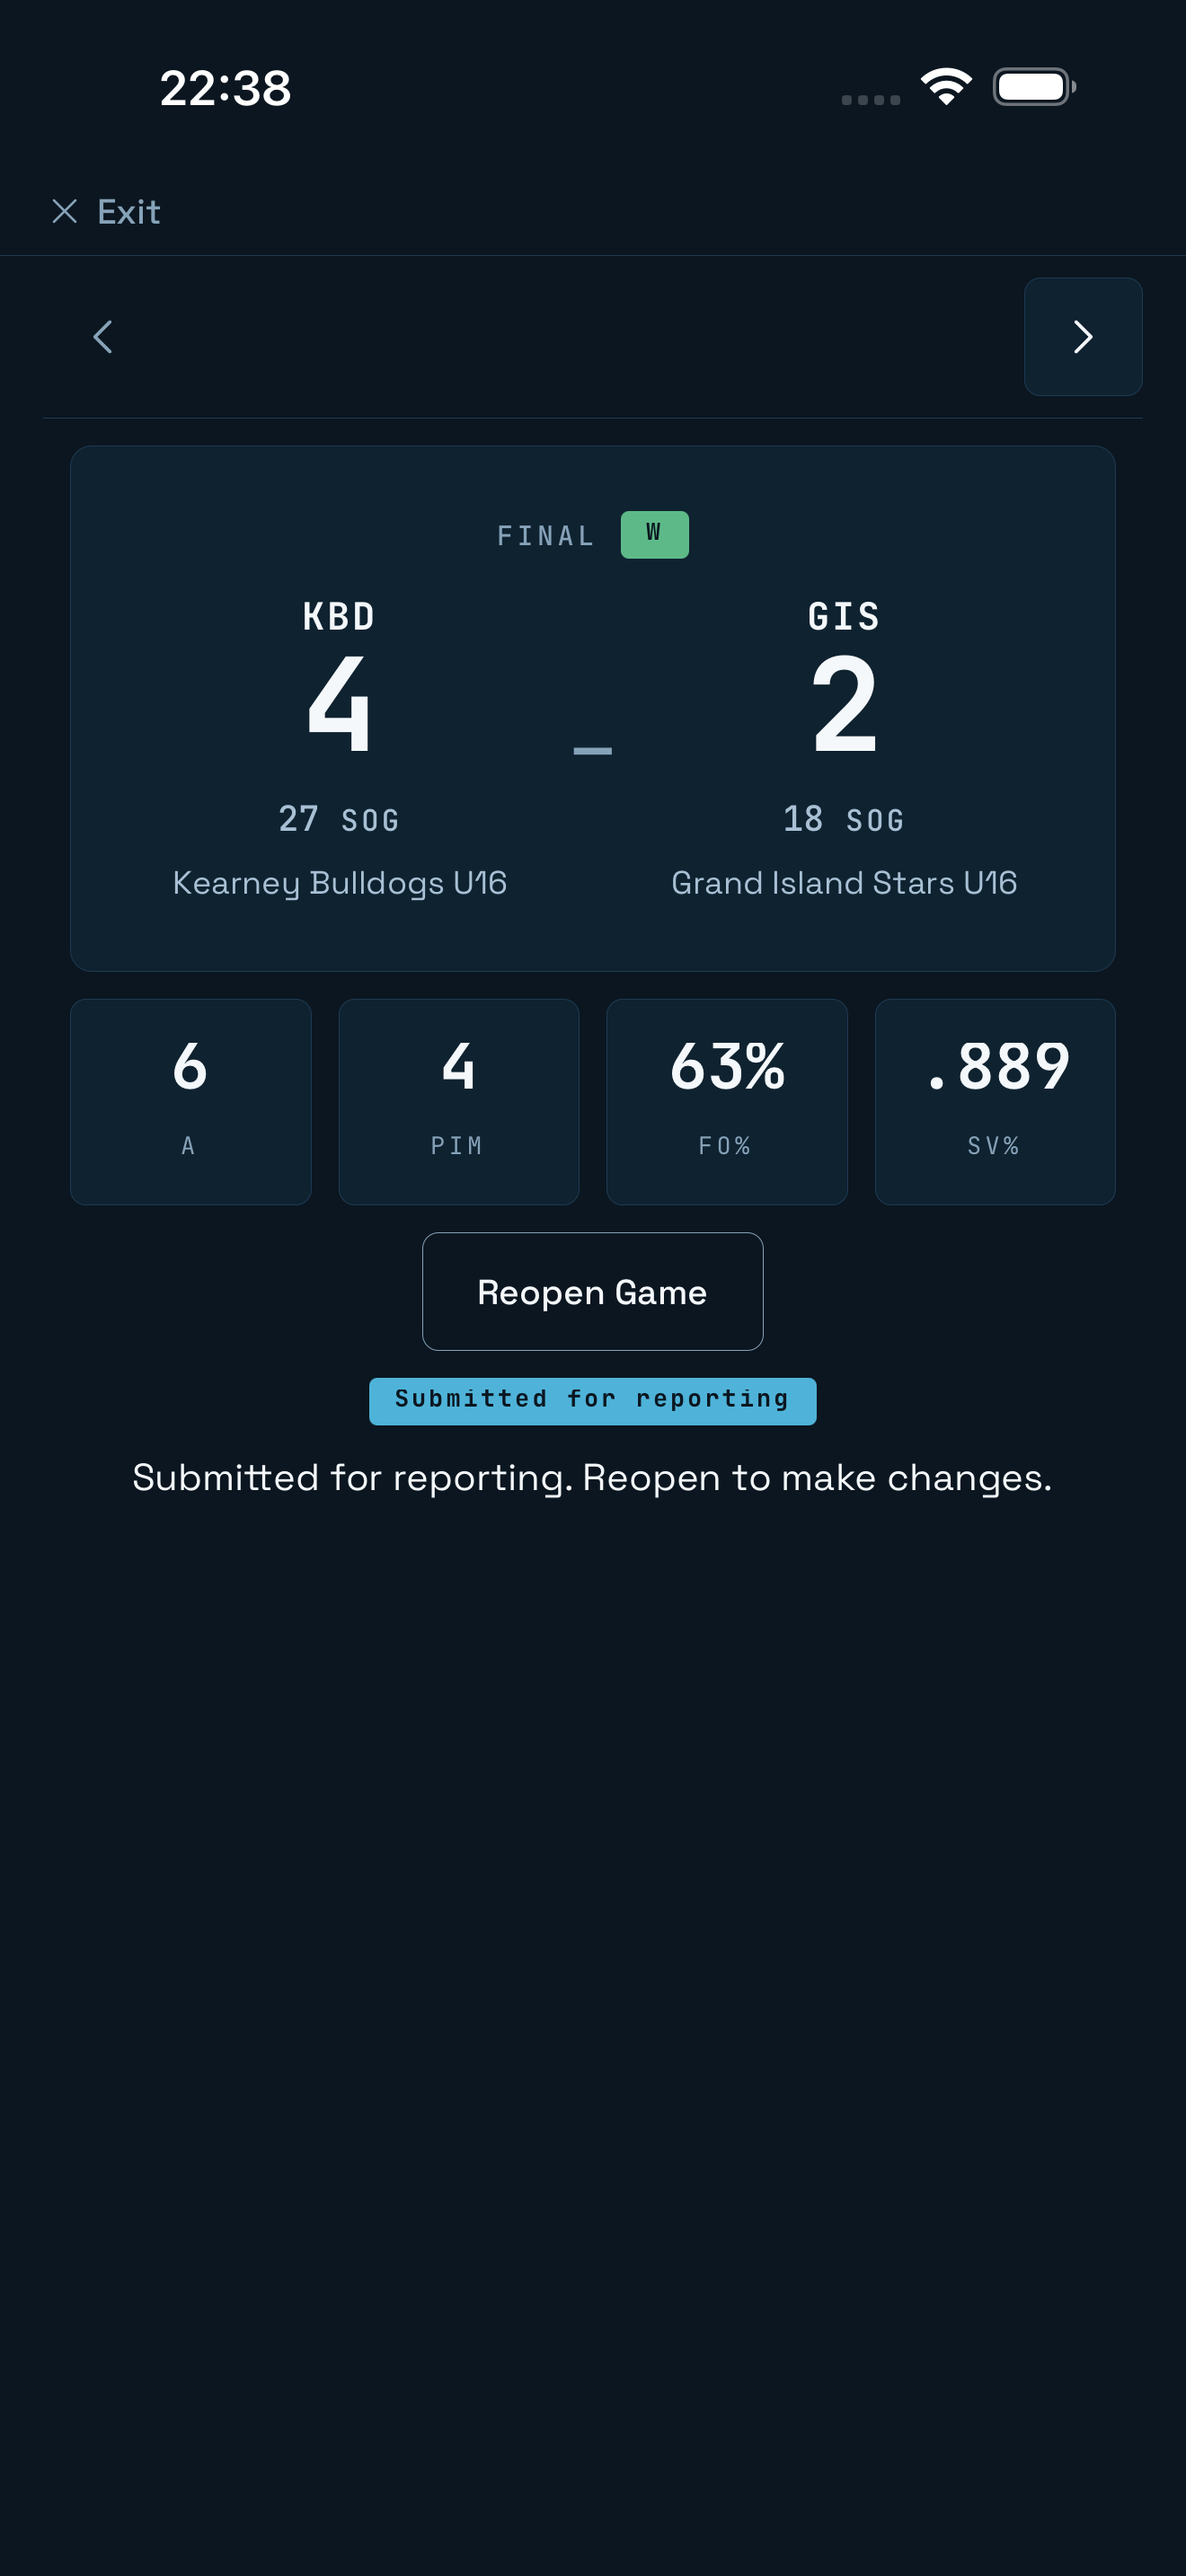
Final scoreboard showing the Kearney Bulldogs beating the Grand Island Stars 4 to 2, 27 to 18 shots on goal, 6 assists, 4 penalty minutes, 63% faceoffs, a .889 save percentage, and "Submitted for reporting"
FinalSubmit it, and the report builds itself
Your stats site

Every game you track builds your player's own stats site.

Reports don't disappear into a camera roll. Each one feeds a clean, shareable stats site — season trends, team leaderboards, and game-by-game logs that grow all season long.
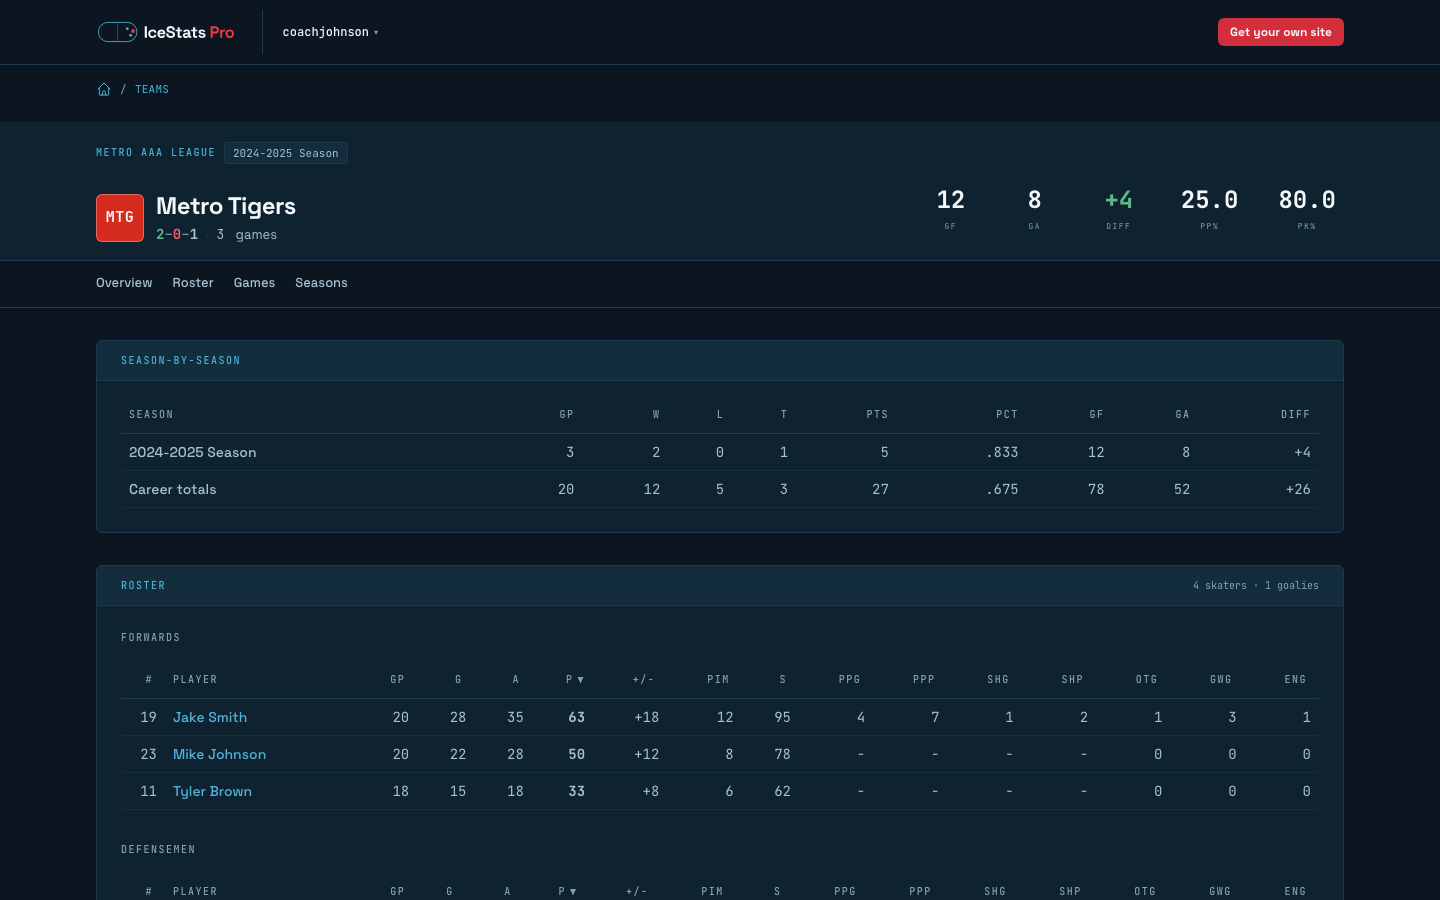
Team overview page for the Metro Tigers: a masthead with the 2-0-1 record and goals for, against, differential, power-play and penalty-kill percentage tiles, a subnav of Overview, Roster, Games and Seasons, then a season-by-season table and the roster with each skater's stats
Team overviewThe season at a glance
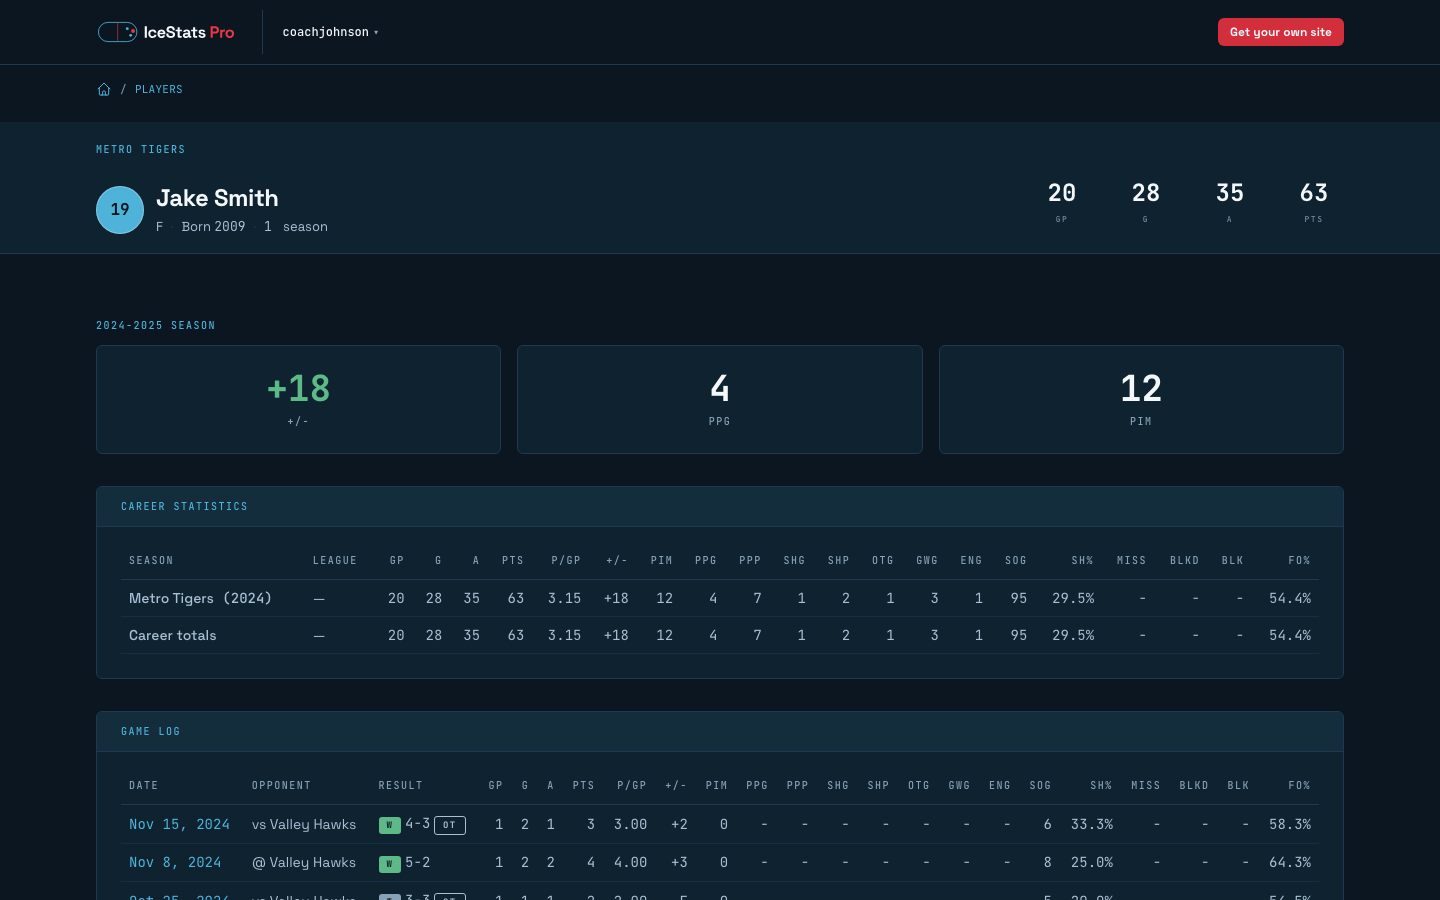
Player page for forward Jake Smith: a masthead with games played, goals, assists and points, season highlight cards for plus-minus, power-play goals and penalty minutes, a career statistics table, and the start of a game log listing each game with its result and stat line
Player detailEvery game, stat by stat
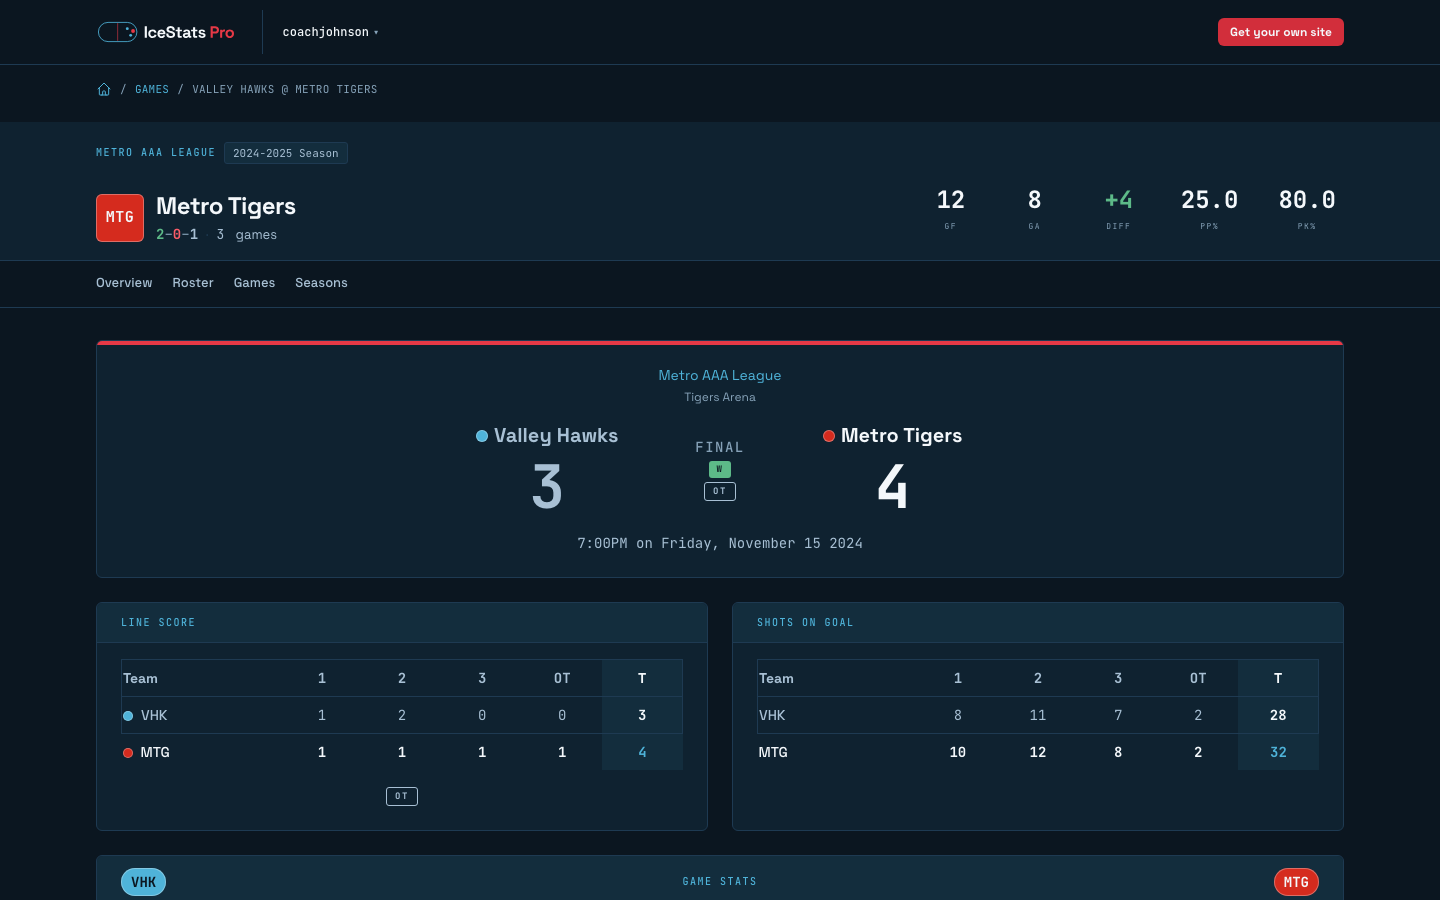
Game page for Valley Hawks at Metro Tigers: the Metro Tigers team masthead and subnav above the score header for a 4-3 overtime win for the Metro Tigers, then the period-by-period line score and shots on goal tables, with the game stats header at the bottom edge
Game detailBox scores like the pros
Pricing

Pay by the report. No subscriptions.

Less than a cup of coffee.

Tracking via the app is always free. When you want a clean, shareable report of the game, it costs less than the coffee you're holding in the stands.

And every game report you add makes your personal stats site exponentially more valuable: trends sharpen, leaderboards fill in, and the season's story gets deeper with every game.

See how Player and Team Reports differ on the pricing page.

The beta

Join the closed beta.

We're letting hockey families and coaches in a group at a time. Leave your email and we'll send your invite.

Beta testers get free report credits. We use your email to send your invite, nothing else. Read our privacy policy.